NServiceBus high load performance tricks
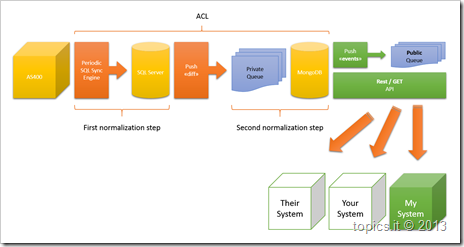
We have the following pretty complex integration layer to move data from AS400 to a much more confortable structure on MongoDB:
We set it up and deployed in a staging environment to start testing, the first normalization step is out of our control and is periodically run every 15 minutes, currently, but the plan is to move it to a 5 minutes schedule in the future.
Everything works fine so we started doing some real testing with some load, so to be able to measure performance and to try to predict what will be the worst scenario in production.
Once the first normalization step is completed, for every detected change in the source AS400 a message is pushed in our listening queue (MSMQ), for each message we go back to the source SQL Server, call 3 or 4 (depending on the incoming message) stored procedures, transform data an store them into MongoDB.
The whole process, in the not so fast, staging environment takes 238ms per message, at first I thought: pretty good, with all we do processing 4 message per second is not so bad…well, not so bad unless we take a look at how the AS400 production environment behaves during normal operations.
The worst case we observed is something internally called “massive update” (it is not so hard to understand what the scenario is):
- A guy on the AS400 side does something on the system that changes 200.000 records…;
- When the first normalization step runs we will have 200.000 messages pushes in a bunch of seconds to our queue;
- 4msgs/sec == 50.000 sec == 834 minutes == 13 hours…;
- WTF…the next refresh of the first normalization step will be 12 hours and 45 minutes before we can handle it…
It is a no go, period.
We started doing some performance investigation and, to make a long story short, we discovered that:
- The DTC was taking the 30% of that time, but we can get rid of the DTC because we have in the incoming message enough information to run our de-duplication logic and our ordering logic;
- The logging infrastructure was consuming the 80% of the handling time, yes the 80% percent;
So, disabling the DTC and tuning the logging infrastructure using setting the logging level to WARN and carefully adjusting what we emit to the log, we moved from 238ms per message to 38ms per message, not so bad as a performance gain, isn’t it?
So now we have:
- 26msgs/sec == 7.700 sec == 128 minutes == 2 hours
it is still not enough to face a “massive update” on a 5 minutes window, but now we can introduce some more logic that:
- handle the incoming message and the first consideration will be: is the changed element older than one year?
- No: handle it immediately, we care for it;
- Yes: defer it for later, or forward it to a low priority service, we are definitely interested in the reported change but since the change affect some old record we can process it later, without any hurry;
And given the above conditions we can safely say that even in case of a “massive update” we can react properly, may our processing time won’t be within the 5 minutes window, but since massive updates are not something that happens daily we can tolerate it.
.m
